eBook
Understanding SMF Records and Their Value to IT Analytics & Security
Download this eBook to learn how Ironstream provides an easy, cost-effective approach for your organization to get a complete view of its entire IT infrastructure. Understand how Ironstream integrates key performance indicators and security events contained within SMF records on the IBM z/OS platform.
Introduction
The IBM Z mainframe is the inner sanctum of a large organization’s IT infrastructure. It guards the informational crown jewels of an enterprise and its operations have long been cloaked in arcane terminology. But the aura of mystery around the mainframe is disappearing as the IT world continues to move out of the realm of siloed systems.
This de-siloing is being driven by two major trends:
- The emergence of platforms such as Splunk, ServiceNow and others that provide enhanced analytics and common views across all platforms in the enterprise. The mainframe is no longer a silo entity that has to be managed entirely on its own.
- An aging and retiring mainframe workforce that for decades has used specialized tools requiring in-depth understanding of mainframe environments for analysis. This workforce is being replaced by a newer generation of IT specialists with different skills, requiring a new set of tools and technologies.
However, at the center of this movement to cross-enterprise analytics platforms lies the most critical source of mainframe information. The System Management Facility (SMF) — a key component of the z/OS operating system. Getting the information out of SMF and into an analytics platform enables IT to get these valuable insights to more people who need it throughout the company – including security, operations and compliance teams – without requiring IBM mainframe expertise or specialized tools.
For CIOs, CTOs, CISOs and other IT personnel who may not be deeply involved with IBM Z System software, some familiarity with SMF can be useful in seeing how the non-mainframe areas of an organization can leverage its considerable power.


What SMF Provides
Virtually every operational event that occurs on the mainframe — from a simple log-in attempt at a particular workstation to a potential access breach of secured resources — can be captured and recorded in one or more SMF record types. Hundreds of millions of records might be written to the SMF files (aka datasets) of a typical production installation in a single day. They can be used for accounting and chargeback, capacity planning, tuning and performance management, data-center reporting, troubleshooting, and activity monitoring. Dozens of vendor products – as well as those from IBM – provide operational data to the SMF.
SMF Record Types
There is maximum of 256 SMF record types and upwards of 140 in actual use on most z/OS systems. The records are usually denoted as “SMF 70”, or “SMF Type 71”, and so forth. Record types 0 – 127 are reserved for use by IBM operating systems components, and types 128 -255 are used by other vendors to record activity and information related to their products. Since there is no specific mechanism for “claiming” a record type within the vendor community, most software vendors make the record type a configurable value within their products to avoid recording conflicts with other vendor products. In fact, IBM provides extensive control over what is recorded, enabling an organization to choose record types to be written to SMF datasets. As long as the data is recorded, it can provide useful information about user activity, security breaches, system performance, and more.
The Complexity of SMF Data
Terabytes of real-time and historical information on business, security, and technical operations concerning the z/OS system can be recorded to SMF daily for each system. Each record contains a standard SMF header that identifies the record type, length of the record, the date & time the record was written, the ID of the system the record was created on, and possibly the record sub-type number — since some records contain sub-types — with a subset of information.
Each header in a record is followed by a “self-defining” portion which identifies the unique sections of the record. In many cases, an SMF record may contain sections that occur multiple times. In these cases, sections can be located within the SMF record by three components – a convention called ‘triplets’. Triplets include:
- Offset to a particular section from the start of the SMF record
- Length of the section in bytes
- Number of like sections that exist in the record
There can even be multiple section types, with multiple sections for each type in a given SMF record, so ‘triplets’ may occur multiple times depending upon the record. Actual data sections and fields follow the “self-defining” portion of the records.
Fields can be in a variety of data formats including EBCDIC data, bit flags, hexadecimal values, etc. Remember that most of the data formats for IBM mainframe data are unique to the platform. So understanding and de-coupling the sections within a record is just one challenge in getting SMF data into an analytics platform. Another requires a re-formatting or “flattening” of the fields within SMF records to convert EBCDIC data, bit flags, and hexadecimal values to standard ASCII data so it can be used within an analytics platform.
Record types may also change and evolve as the underlying subsystem or application evolves. Each release of z/OS and each new processor family can mean a change in the order or contents of the SMF records creating yet another challenge in extracting information from SMF data. Whatever tool is forwarding z/OS SMF data to the analytics platform must be cognizant of the record and field formats, as well as changes that might occur from release to release to ensure that data is properly formatted and forwarded.

Extracting Value from SMF Data
The subsidiaries, business units, and departments of the typical large enterprise that rely on the distributed, multi-tiered, multi-vendor, open-source systems in their daily operations have simply lacked the means to see or make use of the informational goldmine contained within SMF. In many cases, they are leveraging analytics platforms while ignoring the mainframe because they simply have no way to deal with the complexities surrounding SMF data. However, there is an abundance of information that simply cannot be ignored.
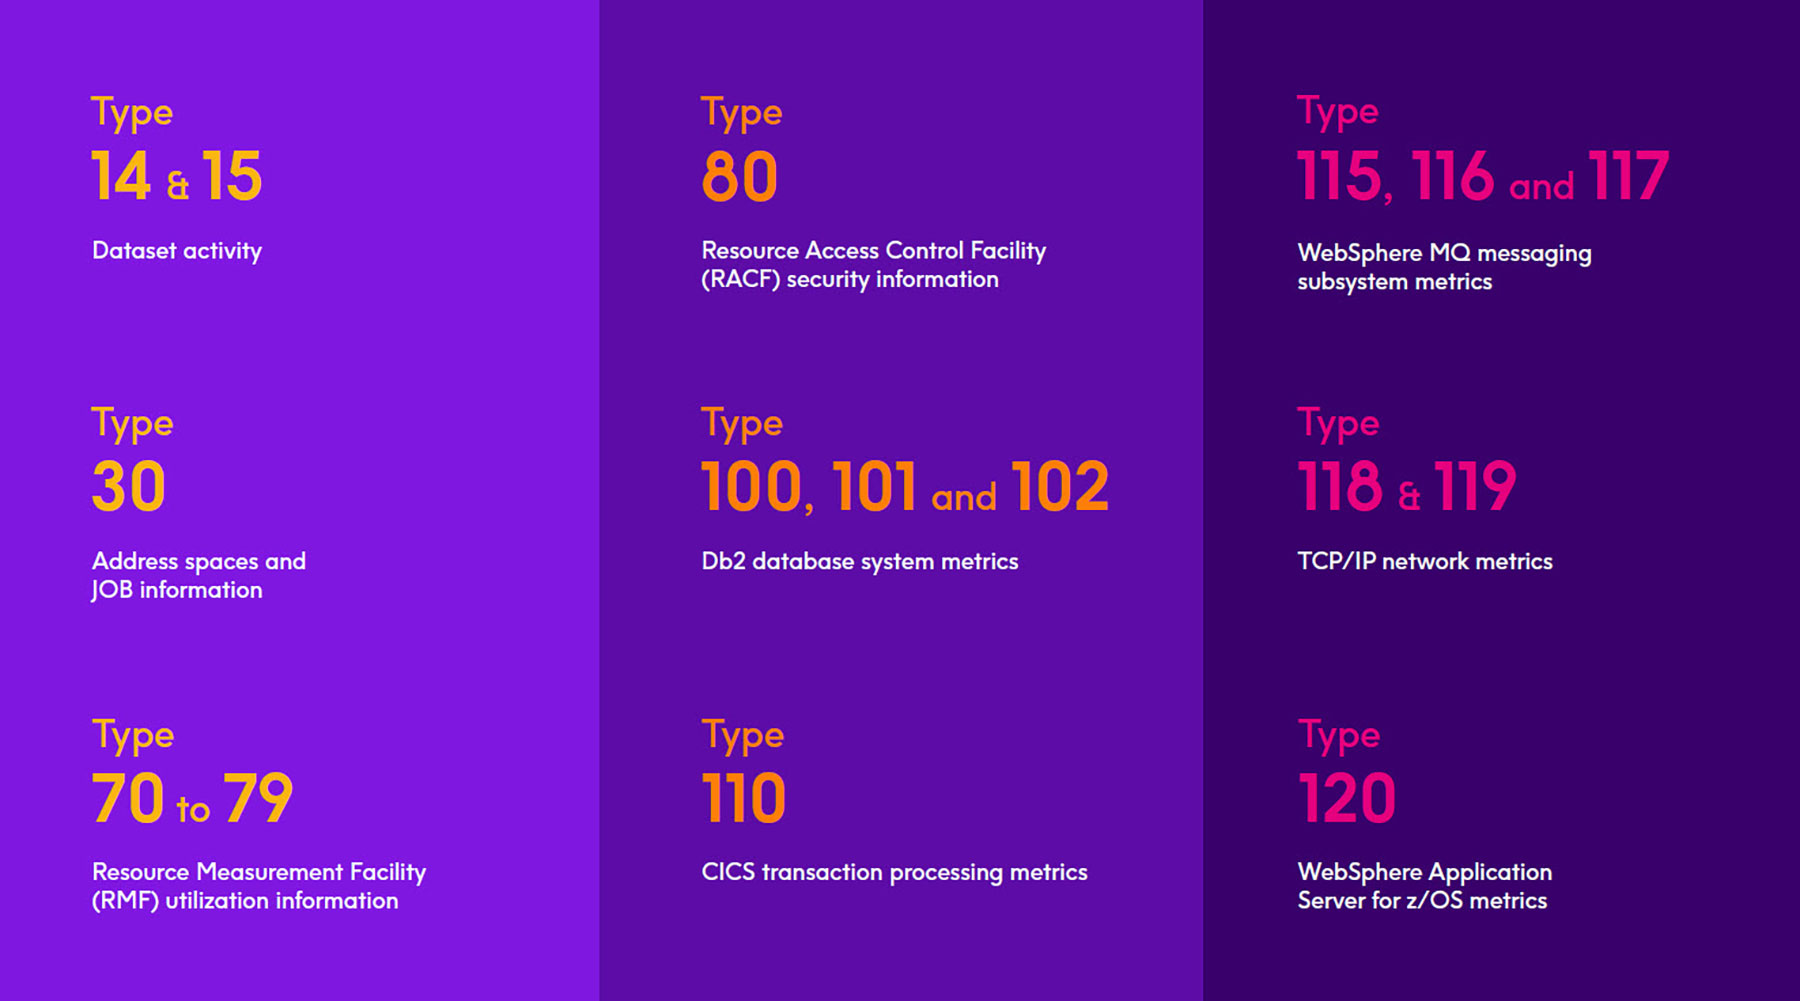
For example, if a mainframe performance specialist sees a bottleneck somewhere in a data channel and needs to zero-in on the cause, he thumbs through (metaphorically speaking) SMF 70 through 79, because those are the records where the Resource Management Facility (RMF) details are kept. However, thumbing through is going to require a product or person with a deep understanding of the record types, because SMF records are not simple in nature.
Security details, such as password violations, denied access attempts, etc., are monitored by the z/OS Resource Access Control Facility (RACF) and recorded in the SMF 80 and 81 record types. SMF 4, 5, 30, 32, 34,
and 35 have fields that contain a variety of performance metrics for each completed job. Metrics for Db2, the primary relational database for the mainframe, are found in SMF record types 100 through 102. CICS transaction processing metrics are written to SMF 110. Metrics on WebSphere MQ messaging performance are sent to SMF 115 and 116, while metrics from the z/OS WebSphere Application Server are sent to SMF 120.
Essentially anything that can help provide IT operational intelligence, as well as security information and event management, can be found within SMF data. Some of the critical record types are as follows:
Using SMF Data for IT Operational Analytics
A large financial institution based on Wall Street, not unlike many other organizations, must run and monitor a nightly schedule of time-sensitive, mission-critical batch jobs. Meeting the time constraints for starting and completing each job is especially important for this institution because of the potential for penalties imposed by government regulators.
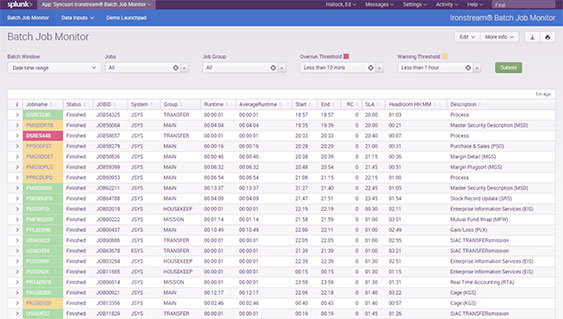
They leveraged Precisely Ironstream to demystify the complexities of SMF data and forward the information to the Splunk analytics platform where a Batch Job Monitor is used to determine if service levels are being met for the execution of critical jobs within their daily batch window.
The image on the right is a screenshot of the Batch Job Monitor dashboard. It shows the completed state of an overnight run between 7 p.m. and 9 a.m. the following day.
The dashboard color codes each job to indicate how close it came to an overrun: green is good, yellow is a warning, and red means an overrun has occurred or finished too close to its scheduled finish time. The dashboard provides the ability to drill-down and understand if predecessor jobs are impacting the on-time completion of a critical workload.
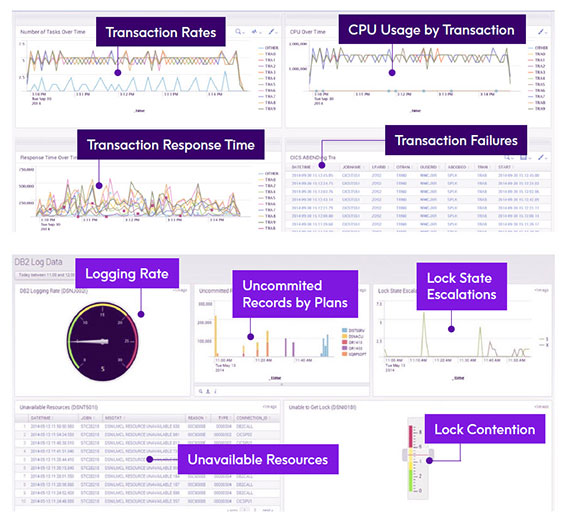
Two of the most critical subsystems on the z/OS platform are CICS and Db2. CICS provides transaction processing on the mainframe and Db2 provides database services. Together these two subsystems provide the back-end processing that happens on the mainframe for many web-based and mobile device-invoked applications. In many cases, CICS transactions will call Db2 to provide database services on behalf of an application. It is critical to understand if CICS transaction response times are being degraded and why. This requires insight into both CICS as well as Db2.
All CICS transaction activity is recorded in SMF Type 110 records, while Db2 information is recorded in types 100, 101, and 102. These records are all very complex in nature with many sub-types to record all the critical activity within CICS and Db2 environments.
The dashboards on the right show critical metrics required to analyze CICS transaction and Db2 database performance. CICS transaction rates, response times, failures and CPU usage are analyzed along with Db2 lock contention and lock escalations.
Using SMF Data for Security Information and Event Management
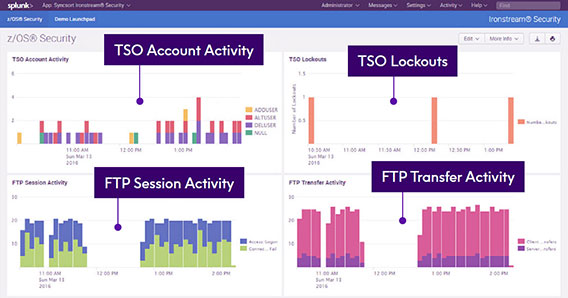
Let’s look at what might need to be captured to monitor security exposures within z/OS. For this case, we probably would want to know a lot about authentication and access failures, TSO Logon and Account Activity, FTP transmissions, changes to user privileges and passwords, changes to the security configuration, data movement, and more. All of this information is contained in SMF records.
- Authentication and access failures would be recorded in SMF Type 80 records
- TSO logon tracking would be recorded in SMF Type 30 Records
- TSO account activity (create, update, delete, lockout) would be obtained from SMF Type 80 Records
- FTP authentications & FTP file analysis (file create, access, update, delete) would be obtained from SMF Type 119 Records
- IP traffic analysis would also be obtained from SMF Type 119 Records
These data sources could then be correlated and analyzed to determine security events and exposures on z/OS. To the right is the sample z/OS Security Application provided by Ironstream with a dashboard showing TSO Account Activity, TSO Lockouts, FTP Session and Transfer Activity.

Conclusion
Understanding the role of the System Management Facility (SMF) on the IBM Z platform is critical in implementing an enterprise-wide analytics solution that includes mainframe metrics.
However, the challenge has become how to extract, correlate, and analyze the wealth of information contained within SMF logs to meet the goals of the organization. The tools and technologies that have been in place for decades, simply do not effectively integrate with modern analytics platforms. Adding to the challenge is a steady decline in subject matter experts and a newer workforce that is unfamiliar with these older tools and struggles to obtain the necessary information from them.
As a result, organizations with mainframe systems have been unable to cost-effectively bring z/OS SMF data into their other machine data flows so they can analyze all of it in one place.
Now with Precisely Ironstream, they can demystify the complexities of SMF data and make those records available to analytics platforms like Splunk, ServiceNow and others. Ironstream provides an easy, cost-effective approach for an organization to get complete view of its entire IT infrastructure by integrating key performance indicators and security events contained within SMF records on the IBM z/OS platform. Organizations can also address the decline of mainframe expertise because with Ironstream, there is no need for special knowledge and expertise to correlate mainframe data with that coming from other platforms.